Financial Reporting: How Pitch Experts Translates Numbers into Business Decisions

Financial reporting isn’t about the numbers. A modern financial presentation is the language of trust: behind every number lies a business story, and leadership uses these stories to decide where the business should go next. The Pitch Experts' Financial Reporting template translates this logic into a visual, decision-support framework.
The Moment of Truth
In the 21st-century business environment, financial reporting has long since moved beyond mere numbers. After the era of spreadsheets, a single chart can now directly influence strategic decisions, and it's only natural that the approach and rhythm of board meetings demand a presentation platform, not Excel. A modern financial report is, in fact, a construct of trust: it reveals reality, the process through which leaders understand what is truly happening in the business and recognize its consequences for the next quarter. The Pitch Experts' Financial Reporting template translates this thinking into a visual, decision-support structure.
Just as the Board Needs It
The template is a data visualization framework that also considers the communication context. It's structured the way a CFO explains things to the board: a brief contextual overview, a clear narrative, and then a deep structural interpretation of the numbers. The initial slides clarify the document's logic: "Briefly introduce the company or organization. Mention the purpose of the presentation…"
From the very first moment, this presentation template signals that the emphasis is not on displaying data but on revealing connections. The goal of the template is to make the numbers tell a story — and that story is about how the past period's performance became the foundation for the business's next steps.
A financial report always tries to answer three questions. What really happened in the business? Is it repeatable? And what are the consequences for the next cycle? Most presentations mistakenly focus on the quantity of numbers, whereas the board's attention is captured by structure, not past data. From a CFO's perspective, a number doesn't carry meaning on its own; rather, it serves as evidence that a business mechanism is working—or that it isn’t.
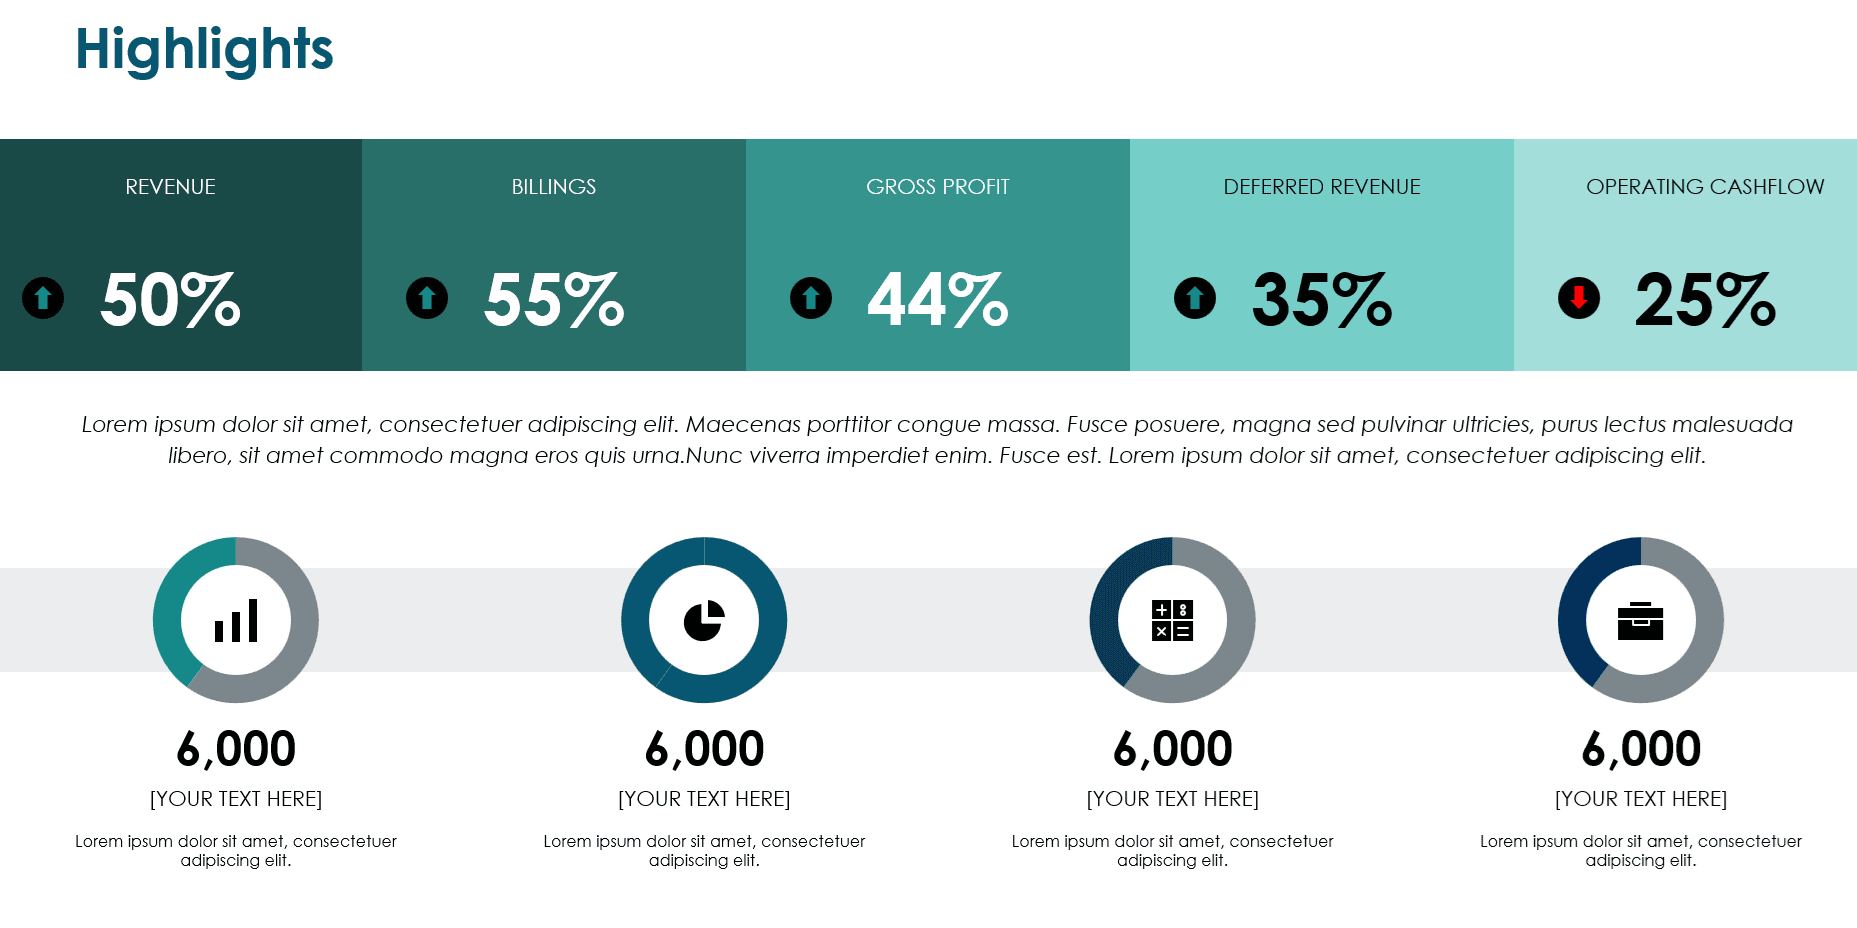
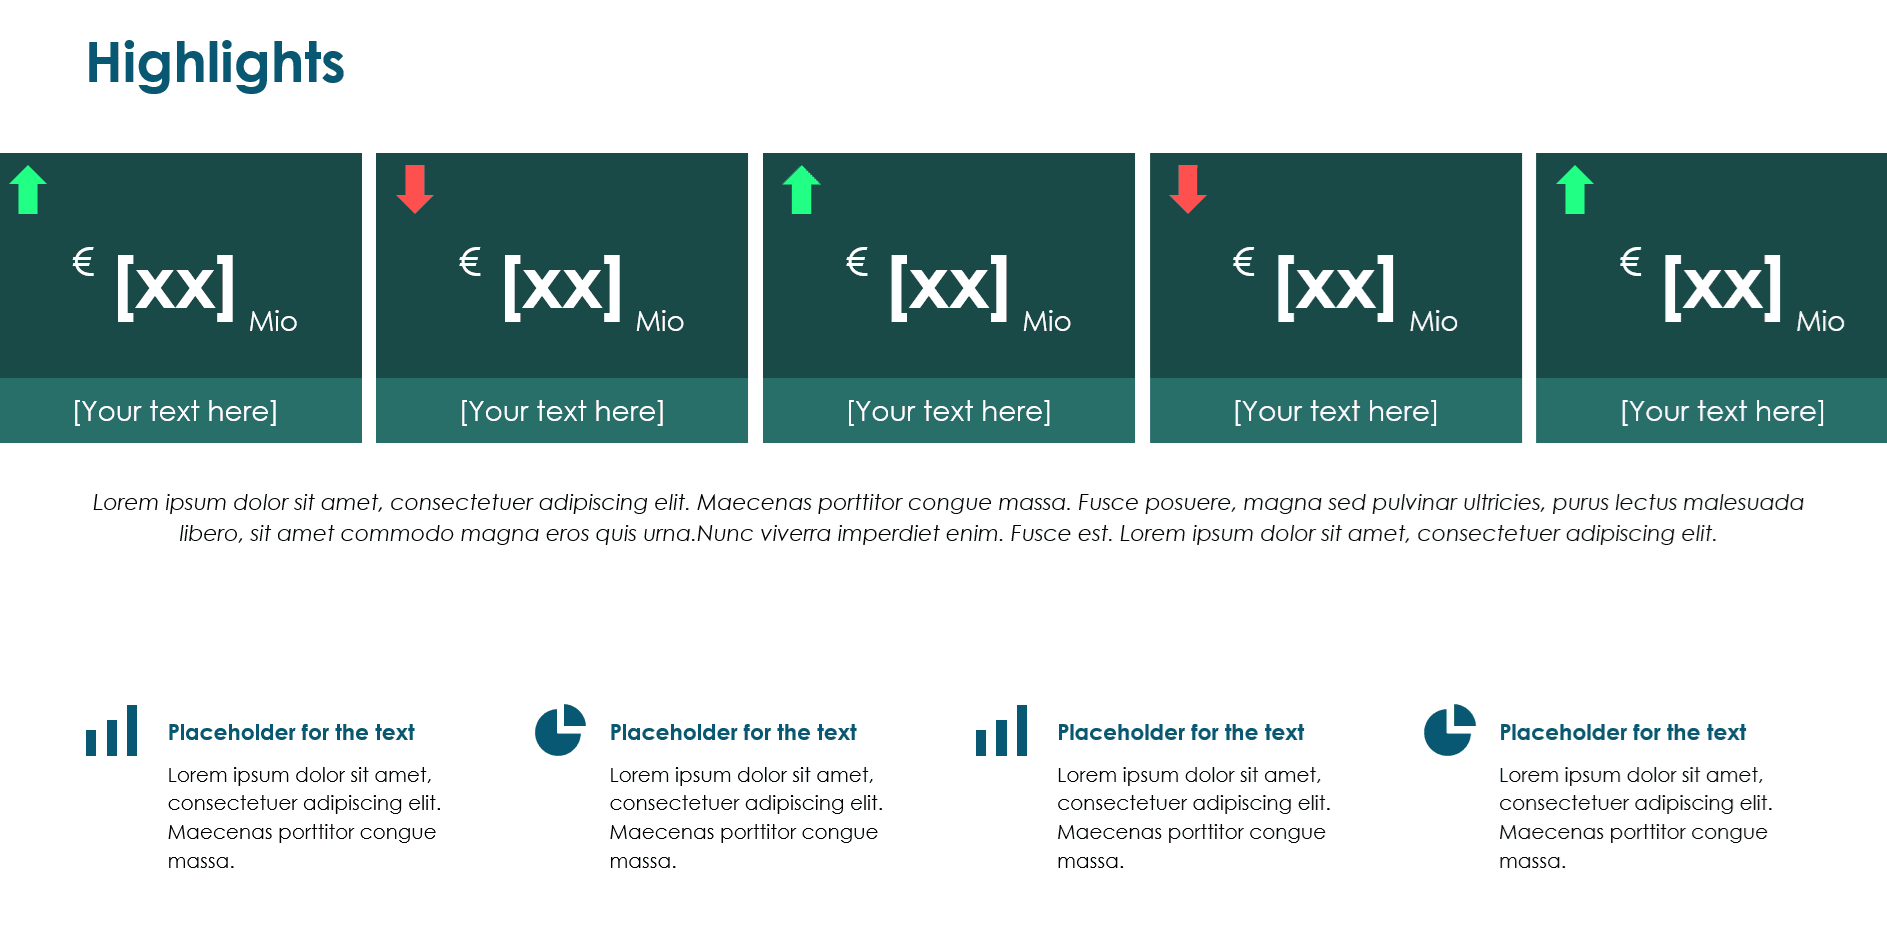
The structure of the Pitch Experts Financial Reporting template follows precisely this logic. It doesn’t move linearly through financial documents but creates narrative blocks: introduction, business highlights, interpretation of financial statements, regional and temporal breakdowns, and finally, a summary and message. The "Highlights" slide, for instance, isn’t a data dump. Its purpose is to provide an instant mental map of the quarter's main message. Visual elements help identify trends because the brain understands patterns much faster than it processes the structure of a table. This allows a leader to grasp where and in what direction change has occurred in a single glance.
How the Financial Reporting Template Gets Deeper
The deeper layer of the report begins where the presentation transitions to the financial statements. The template introduces three key concepts: the Balance Sheet, the Income Statement, and the Cash Flow Statement. It presents them not in Excel format, but with narrative logic. The Balance Sheet is a snapshot of the company's assets and liabilities. The Income Statement is the story of its operations: how revenue and cost structures evolved and what the resulting operating income was. The cash flow is the consequence: the actual movement of money, or what is ultimately realized. The template is built on these three units because this thinking provides the right rhythm for the board. "Basics of financial statement analysis," the slide reads, followed by an explanation of how to see the connections behind the numbers.
Horizontal & Vertical Analysis
The analysis deepens with the presentation of horizontal and vertical structures. The slide title indicates this, but the template provides interpretation, not just an explanation. Horizontal analysis reveals trends: it tracks the change in values over time, making it clear where growth actually comes from. For the board, this is key: decisions aren't about past numbers but about the trends that can be derived from them. Vertical analysis, in contrast, shows structure: it analyzes the percentage-based distribution of costs and revenues. Leaders aren’t interested in the sums themselves but in their distribution—the structure. A one-percentage-point change often says more than a ten-million-dollar variance.
Tools of Analysis
The template dedicates a separate block to financial ratios. "Tools of analysis," it says, followed by an interpretive structure: ROI, ROE, EPS, EBITDA. For a CFO, these are not abstract acronyms; each ratio summarizes the company's performance in a single sentence. Return metrics, for example, ask: how efficiently is the business using its available capital? EBITDA shows what business value is being generated without the distortion of the financing structure. The question in a board meeting is not the exact EBITDA figure, but where it came from: for instance, from volume, pricing, cost reduction, product portfolio mix, or currency effects. The value of this Financial Reporting template is that it condenses this into the visual logic of a single slide.
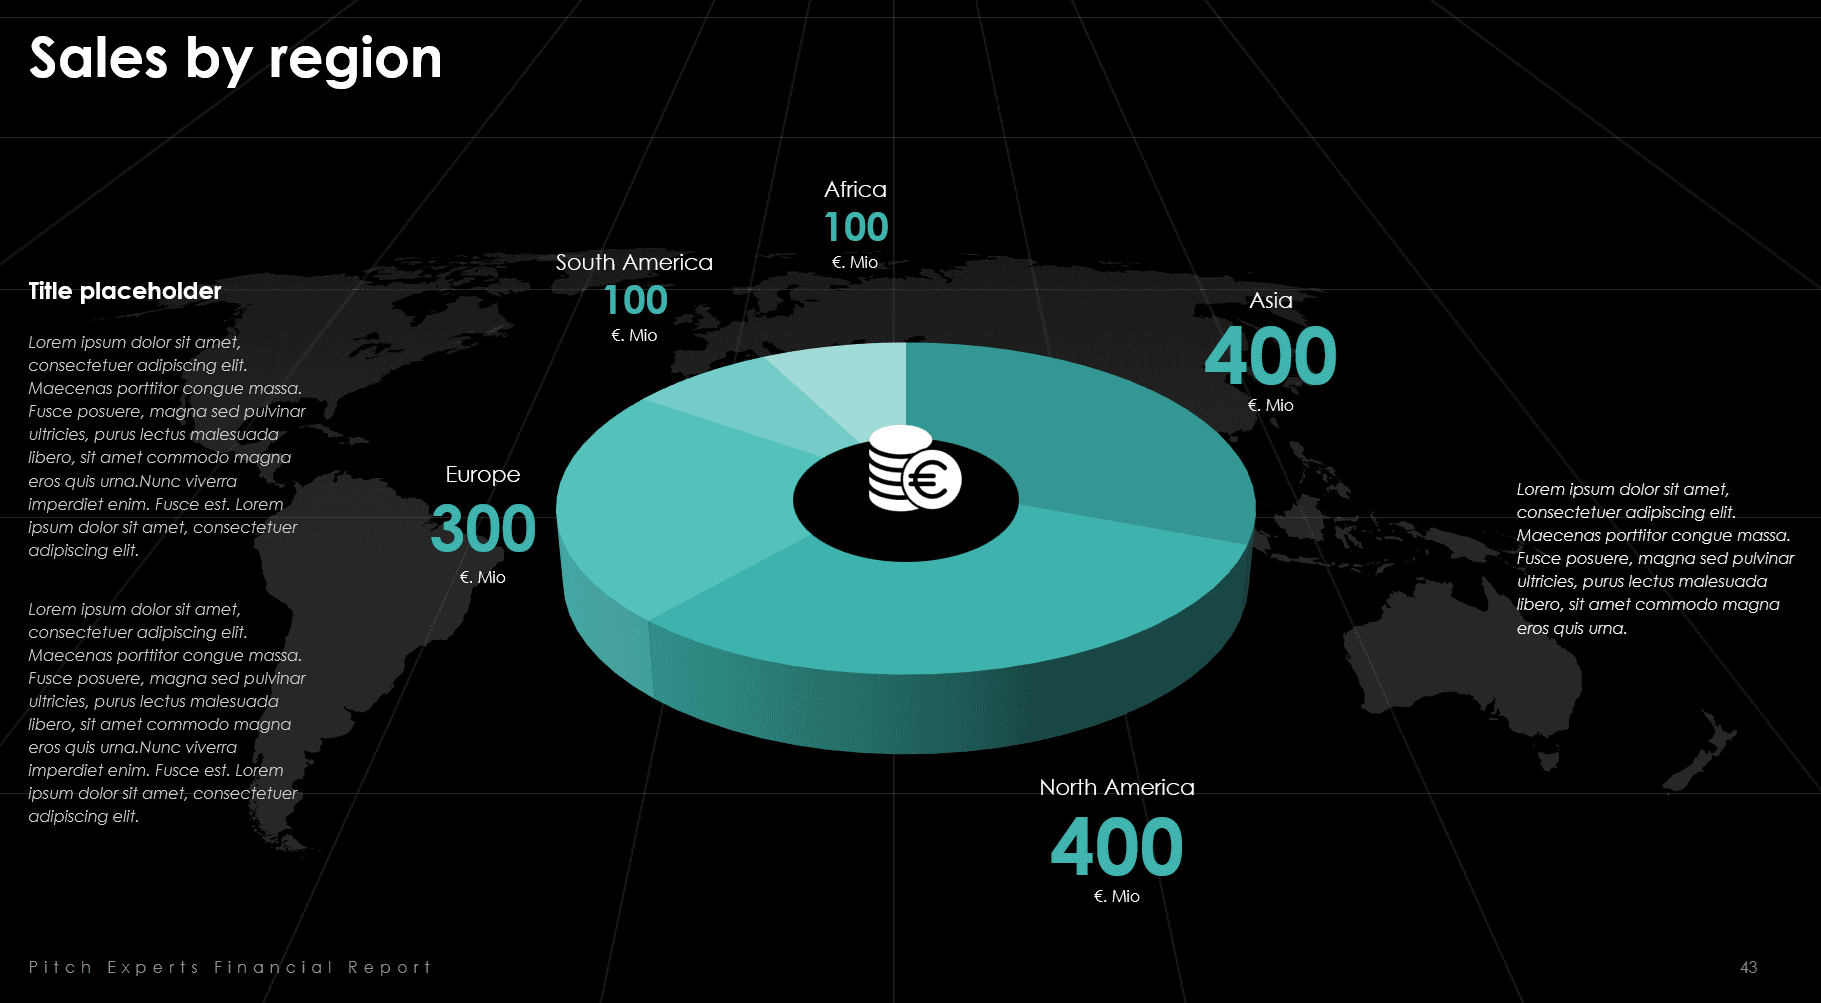
Sales by Region
Regional analysis appears as a separate unit. "Sales by region," of course, doesn't just convey geographical data. This is where the board understands which markets the business operates in, where exposure lies, what currency risks are present, and where real growth is being generated. For the CEO, the primary concern is not the numerical values but the proportions, as these indicate the strategic direction. For instance, if a region is growing rapidly but its EBITDA margin isn't keeping pace, that growth is not actually creating value. The template is an effective tool because its visualizations reveal patterns that would take long minutes to recognize in a spreadsheet.
Timeline
The temporal dimension of the financial report is provided by the timeline. The template uses this tool multiple times because decision-makers think in cycles. A timeline is not a mere graph; it creates rhythm, helps interpret how the business has performed in previous quarters, and projects a future direction. The board is always seeking an answer to whether the current value is part of a trend or an exception. The timeline is therefore not about processing the past but about forecasting: it shows what trajectory a given number places the company on.
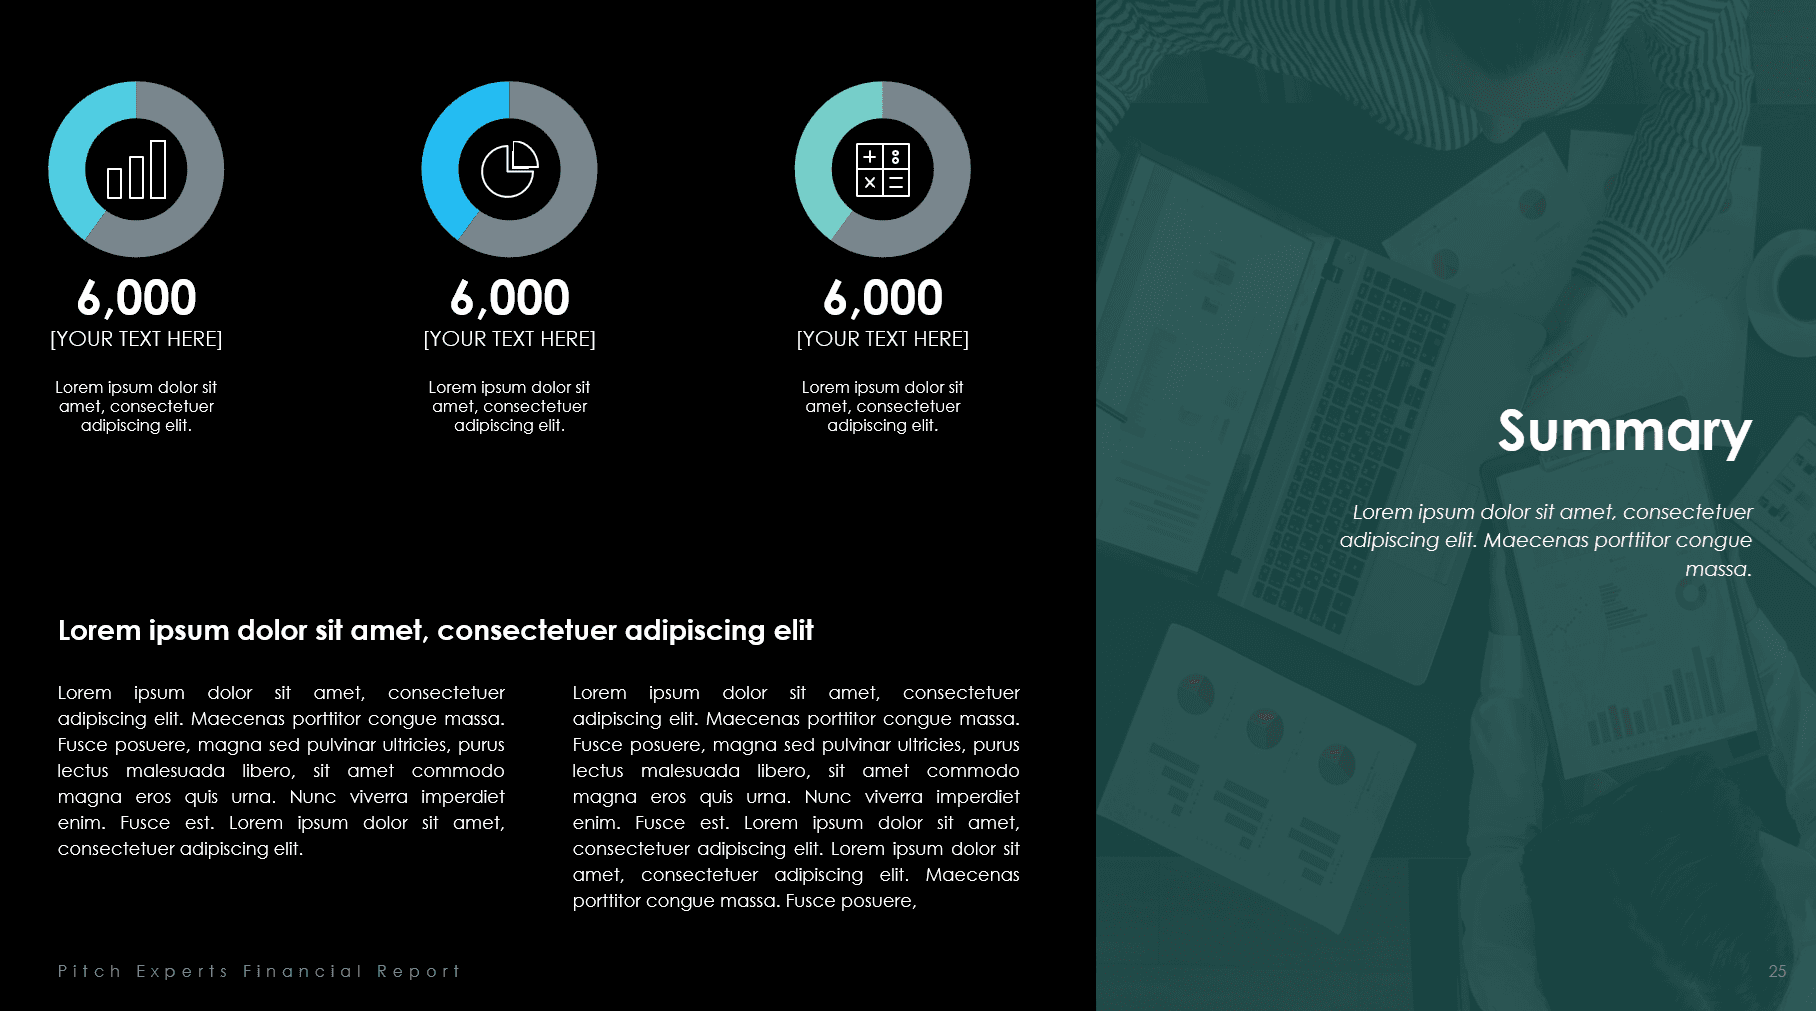
Summary
One of the most powerful parts of the template is the summary. "Summary"—a single word, but the decisive moment of the board meeting. A good summary doesn't repeat; it interprets. A highlighted number — for example, "93%" — is not data but a message: it signifies that the report is fully transparent. This is where leaders make decisions: Is the direction right? Is the business sustainable? And how should the strategy be adjusted? The template constructs this block to clarify the link between business facts and strategic conclusions.
As it turns out, the Pitch Experts' Financial Reporting template is not just a visual tool. Its structure serves as a framework for professional thinking. Its modular design allows it to be a tool in the hands of the CFO, a document for the board, and an explanatory structure for the teams. The presentation is assembled from blocks: each part can be understood independently, but together they can reveal the entire business mechanism. Following this logic, the template easily adapts to a corporate identity: it conveys structure, not content, making it freely adaptable to typography, color palettes, icon systems, and data types.
I need a custom presentation template based on our corporate identity! Contact us today!
Alongside the template, Pitch Experts offers full brand integration and presentation training. The training is not technical instruction but a thinking exercise: how to explain numbers in a way that induces decisions. The hardest part of a CFO's job is that the board doesn't want to hear the numbers; they want to hear what the numbers mean. The Pitch Experts methodology captures this: it turns numbers into a story, and the story into a decision.
I want to learn more about the modules in Pitch Experts' presentation training!
A financial presentation, therefore, is not an informational document. It's where leaders see if the strategy is working. In this template, a number is not data but business reality, presented as a transparent structure. The Financial Reporting template is thus both a presentation tool and a system of thinking. It makes visible what is happening deep within the spreadsheets: the connection between decisions, operations, and results.
What You'll Find in the Financial Reporting Template
The Pitch Experts Financial Reporting presentation template offers a structured presentation framework optimized for executive-level communication of financial data and business performance. The template's slides are designed to ensure that financial information is not presented as a mere set of numbers, but is interpreted along clear correlations in a way that supports business decisions.
The template includes introductory and summary slide types that help contextualize the financial report. These pages are suitable for clarifying the report's purpose, period, and main message right at the start of the presentation. Slides dedicated to presenting financial statements handle the income statement, balance sheet, and cash flow separately, thus clearly distinguishing between different financial perspectives.
One of the strengths of the Financial Reporting template is the diversity of its explanatory and analytical slides. Charts supporting horizontal and vertical analysis allow for the presentation of trends and proportions, while bridge and decomposition diagrams help uncover the reasons behind specific financial changes. These visual solutions are particularly useful in executive and board presentations, where the "why" behind the results is just as important as the results themselves.
The template also includes slide types for regional and temporal breakdowns, which can be used to compare the performance of markets, business units, or time periods. KPI and metric slides provide a structured framework for presenting financial indicators while maintaining clarity. The clean visual style, uniform typography, and well-organized layouts ensure that the Financial Reporting template remains a reliable tool for regular financial communication over the long term.
Financial Reporting template and more: Explore our full library of instantly downloadable presentation templates!
(Please note: We're currently updating our download links. In the meantime, all our templates are ready to go. Just send us a message if you need one right away, and we'll get it to you directly.)
👉 HR Management Template
👉 OKR Template
👉 Communication Models Template
Or, for the ultimate toolkit, you can get our entire collection in one comprehensive bundle!